
See on Scoop.it – Cajón de sastre
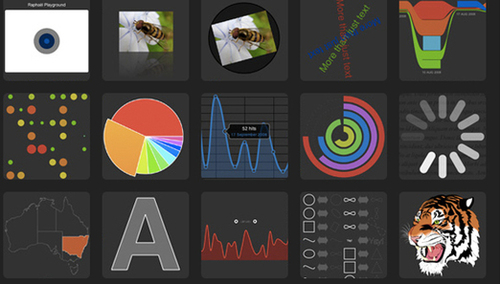
From simple charts to complex maps and infographics, Brian Suda’s round-up of the best – and mostly free – tools has everything you need to bring your data to life…
A common question is how to get started with data visualisations. Beyond following blogs, you need to practice – and to practice, you need to understand the tools available. In this article, get introduced to 20 different tools for creating visualisations…
See on www.netmagazine.com

